Question Title
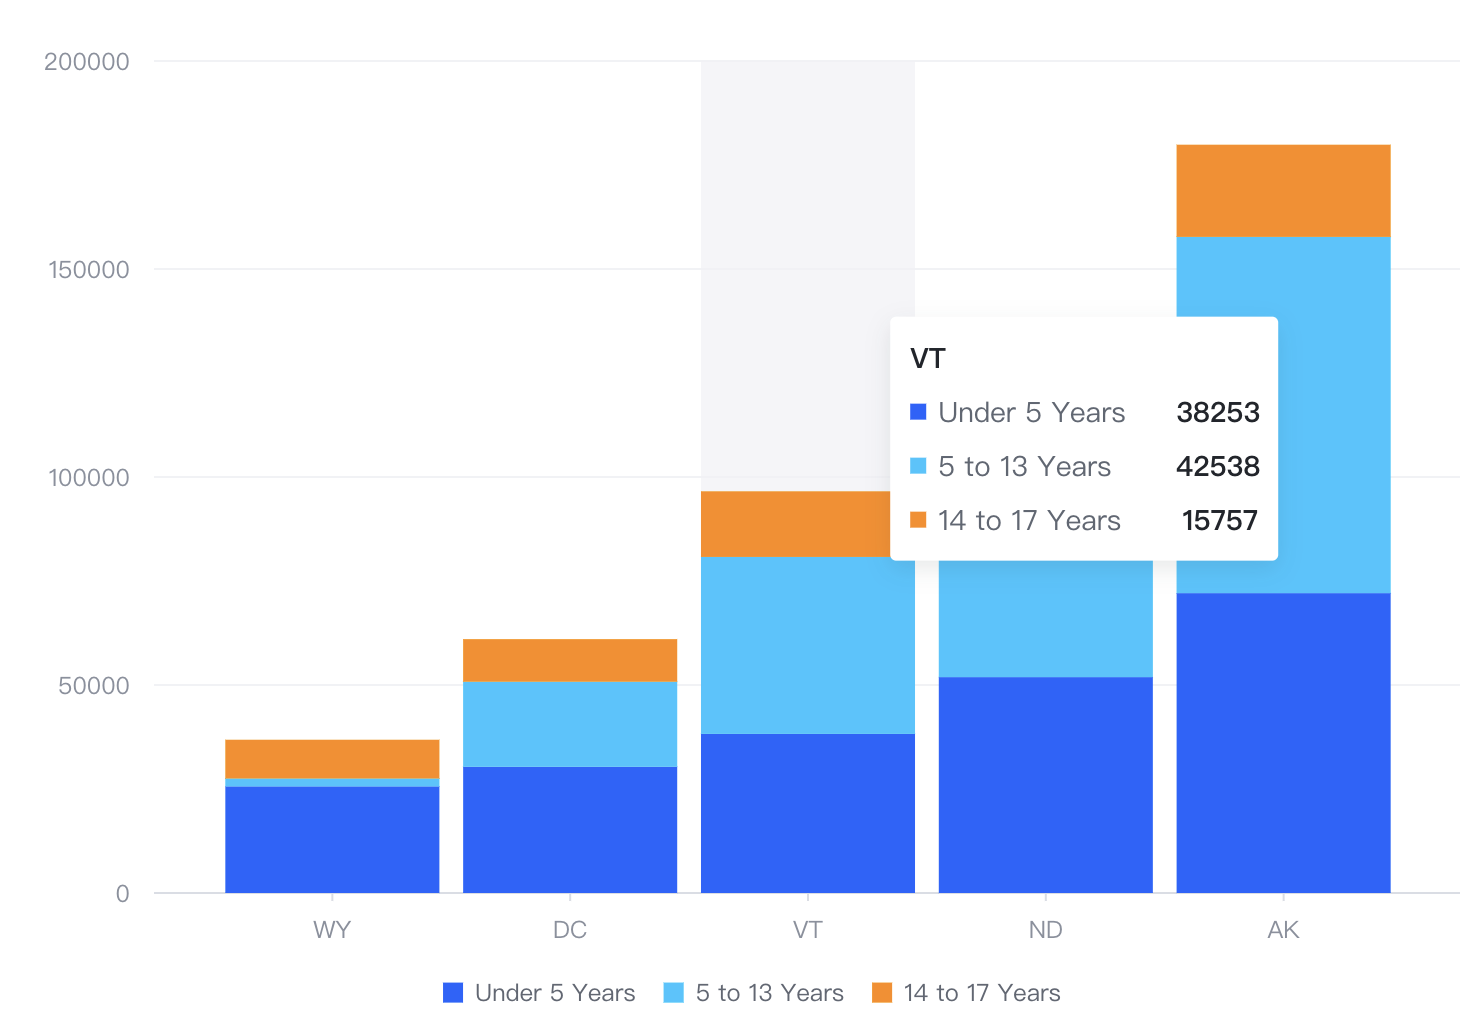
How to support the display of total data in the Tooltip float layer?
Problem Description
In a chart, if you want to display the aggregated value of all the data, is it achievable?

Solution
In VChart, there are three types of tooltips:
- Group Tooltip (group)
- Dimension Tooltip (dimension)
- Graphical Element Tooltip (mark)
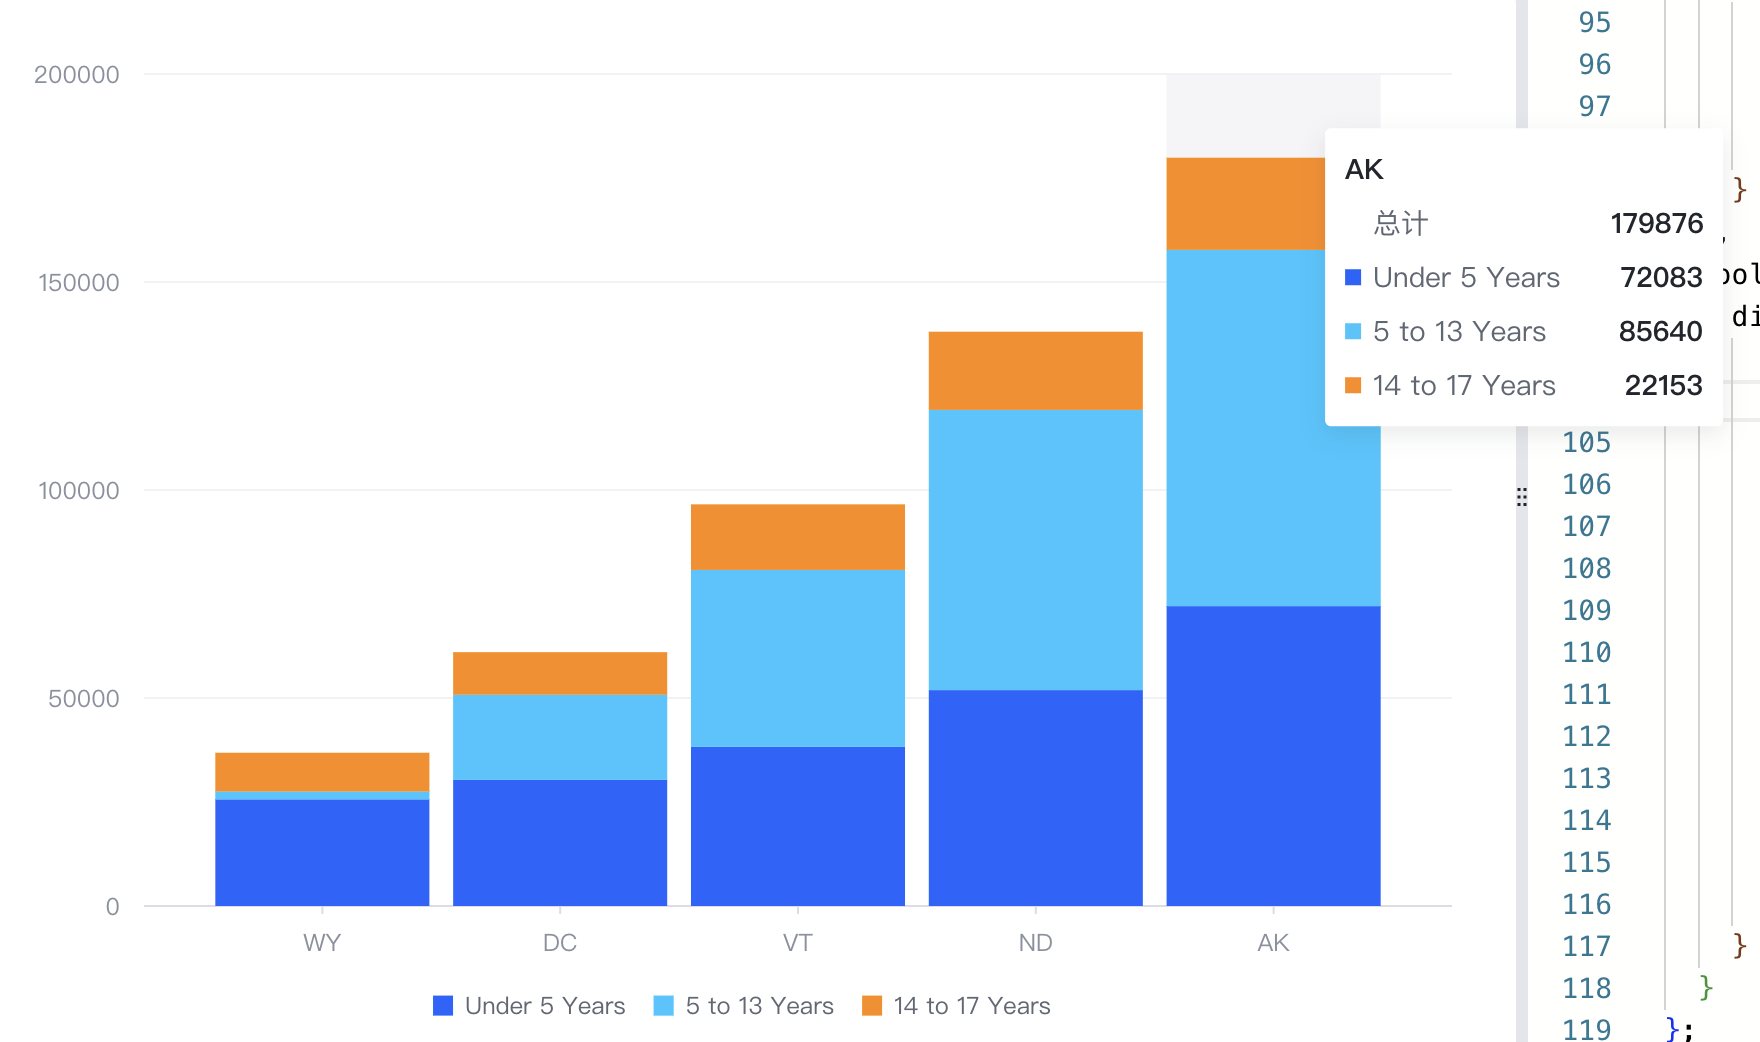
For the display of aggregated data mentioned above, Group Tooltip and Dimension Tooltip are applicable, and custom display can be achieved throughtooltip.dimension.updateContent.
tooltip: {
    dimension: {
      updateContent: (items) => {
        const total = items.reduce((sum, item) => {
          return +item.value + sum;
        }, 0)
        return [
          {
            ...items[0],
            key: '总计',
            value: total,
            hasShape: false,
          },
          ...items
        ];
      }
    }
  }</br>
Code Examples
const spec = {
  type: 'bar',
  data: [
    {
      id: 'barData',
      values: [
        {
          State: 'WY',
          Age: 'Under 5 Years',
          Population: 25635
        },
        {
          State: 'WY',
          Age: '5 to 13 Years',
          Population: 1890
        },
        {
          State: 'WY',
          Age: '14 to 17 Years',
          Population: 9314
        },
        {
          State: 'DC',
          Age: 'Under 5 Years',
          Population: 30352
        },
        {
          State: 'DC',
          Age: '5 to 13 Years',
          Population: 20439
        },
        {
          State: 'DC',
          Age: '14 to 17 Years',
          Population: 10225
        },
        {
          State: 'VT',
          Age: 'Under 5 Years',
          Population: 38253
        },
        {
          State: 'VT',
          Age: '5 to 13 Years',
          Population: 42538
        },
        {
          State: 'VT',
          Age: '14 to 17 Years',
          Population: 15757
        },
        {
          State: 'ND',
          Age: 'Under 5 Years',
          Population: 51896
        },
        {
          State: 'ND',
          Age: '5 to 13 Years',
          Population: 67358
        },
        {
          State: 'ND',
          Age: '14 to 17 Years',
          Population: 18794
        },
        {
          State: 'AK',
          Age: 'Under 5 Years',
          Population: 72083
        },
        {
          State: 'AK',
          Age: '5 to 13 Years',
          Population: 85640
        },
        {
          State: 'AK',
          Age: '14 to 17 Years',
          Population: 22153
        }
      ]
    }
  ],
  xField: 'State',
  yField: 'Population',
  seriesField: 'Age',
  stack: true,
  legends: {
    visible: true
  },
  bar: {
    // The state style of bar
    state: {
      hover: {
        stroke: '#000',
        lineWidth: 1
      }
    }
  },
  tooltip: {
    dimension: {
      updateContent: (items) => {
        const total = items.reduce((sum, item) => {
          return +item.value + sum;
        }, 0)
        return [
          {
            ...items[0],
            key: '总计',
            value: total,
            hasShape: false,
          },
          ...items
        ];
      }
    }
  }
};</br>
Result Display

